Uploads by Jcrossle
From CASA Guides
Jump to navigationJump to search
This special page shows all uploaded files.
| Date | Name | Thumbnail | Size | Description | Versions |
|---|---|---|---|---|---|
| 19:33, 5 October 2011 | Simdata inp example.png (file) | 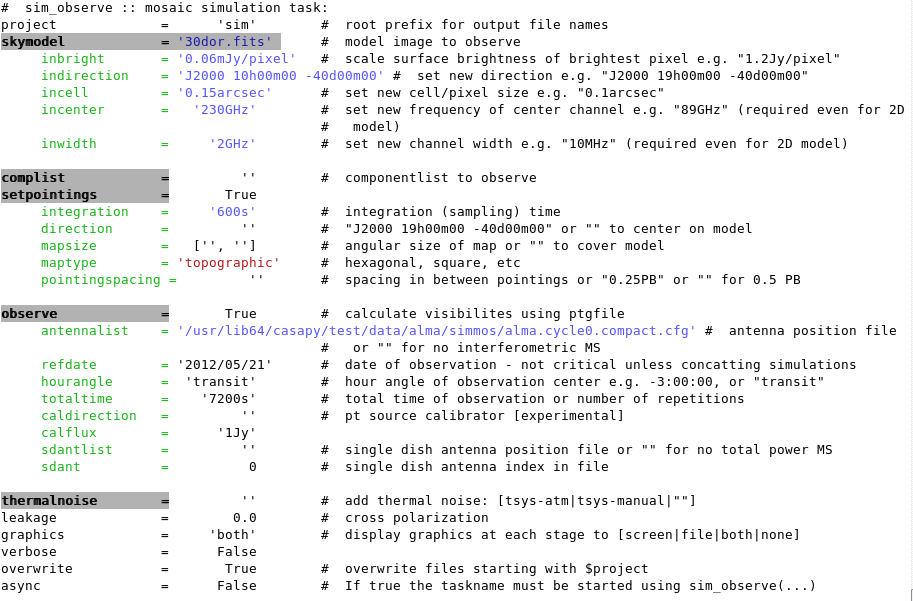 |
114 KB | sim_observe inputs | 4 |
| 20:32, 5 October 2011 | 30Doradus.sim.image.png (file) | 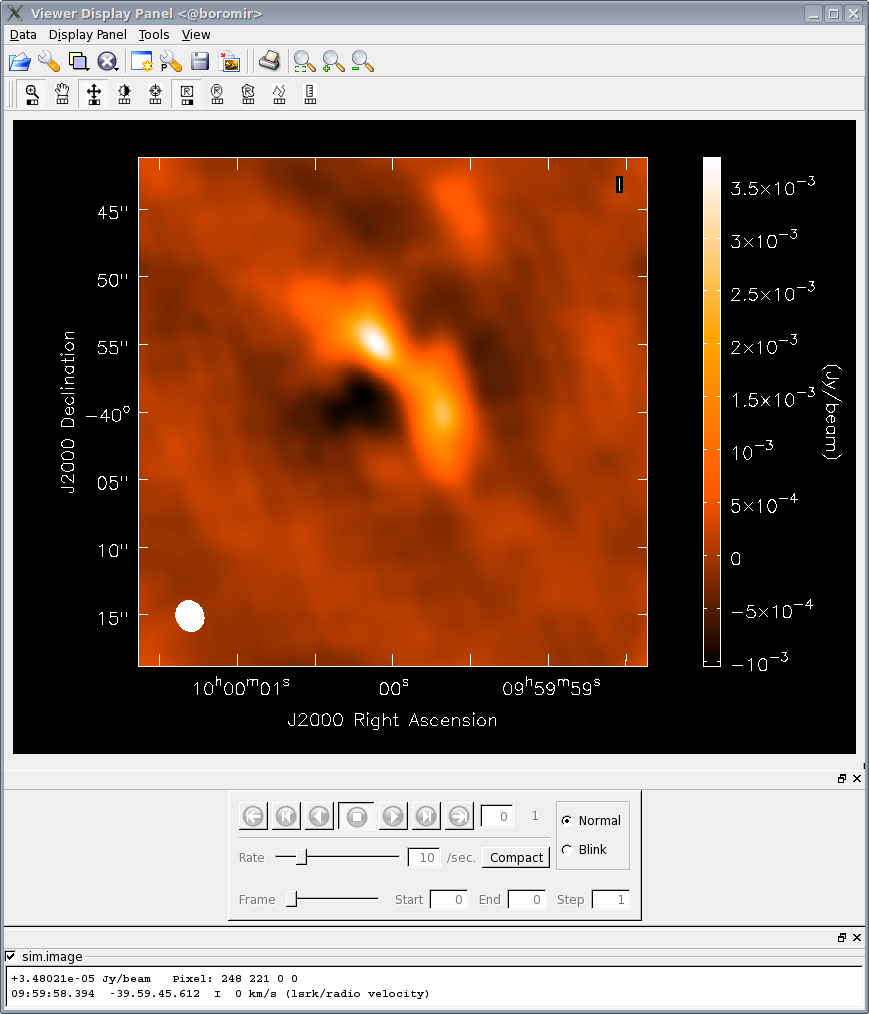 |
78 KB | 2 | |
| 14:17, 19 October 2011 | Sim.observe.png (file) | 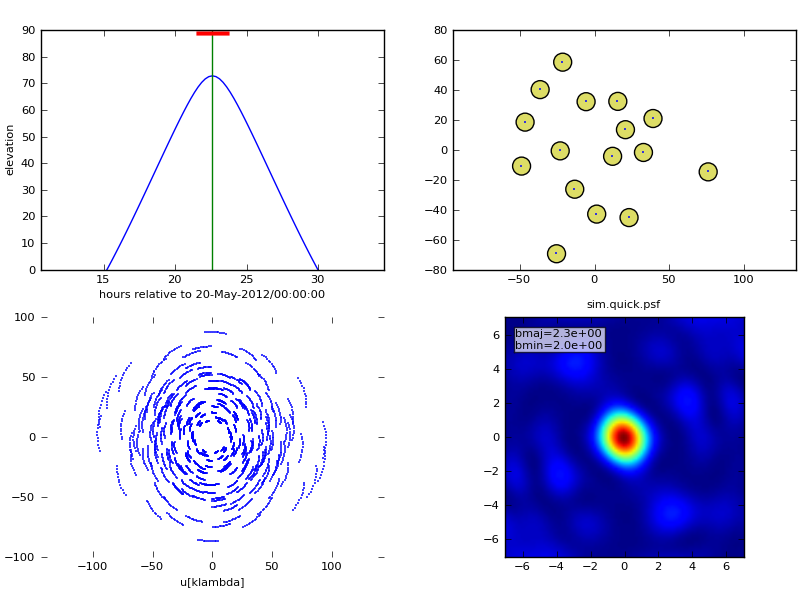 |
86 KB | sim_observe summary PNG file. | 1 |
| 14:28, 19 October 2011 | Sim.analysis 2.png (file) | 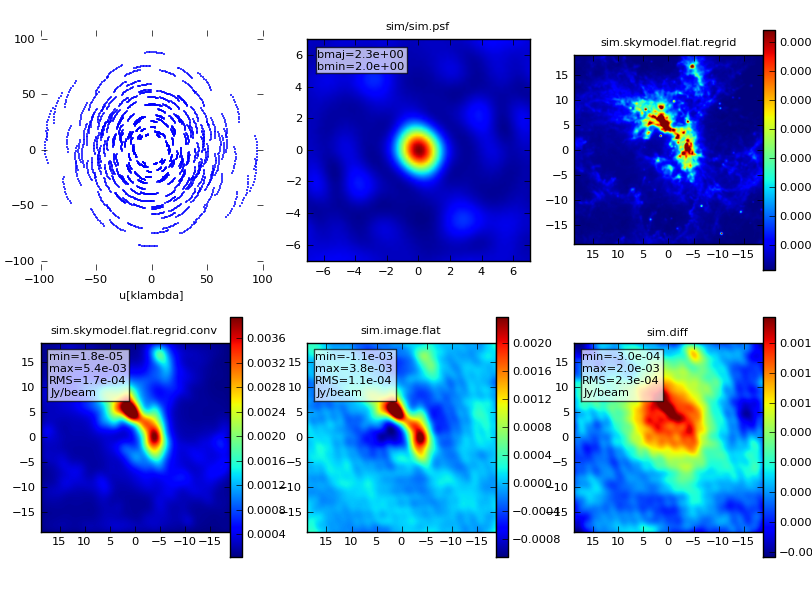 |
234 KB | Output of sim_analyze. | 1 |
| 17:59, 28 October 2011 | M51-ATZ-p1.alma 0.360000arcsec.observe.png (file) | 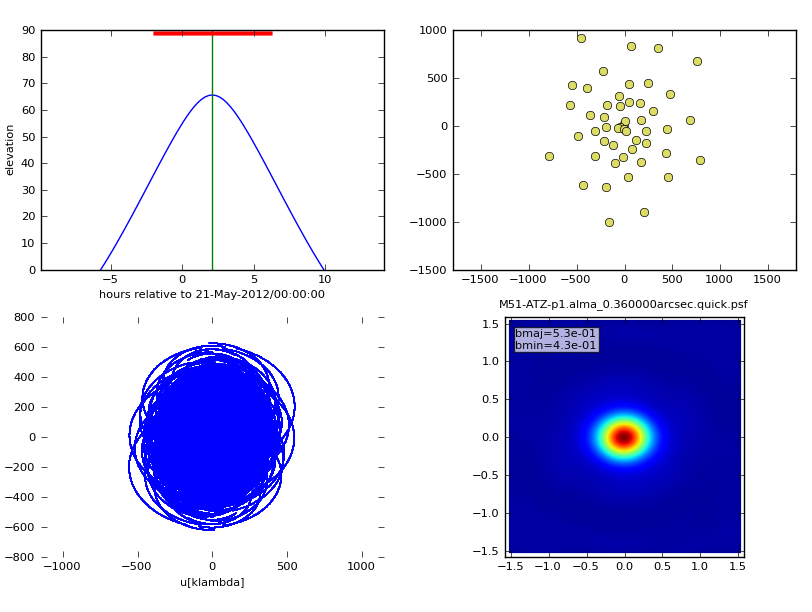 |
67 KB | sim_observe PNG summary plot for the M51 simulation. | 1 |
| 20:14, 28 October 2011 | M51-ATZ-p1.alma 0.360000arcsec.analysis.png (file) | 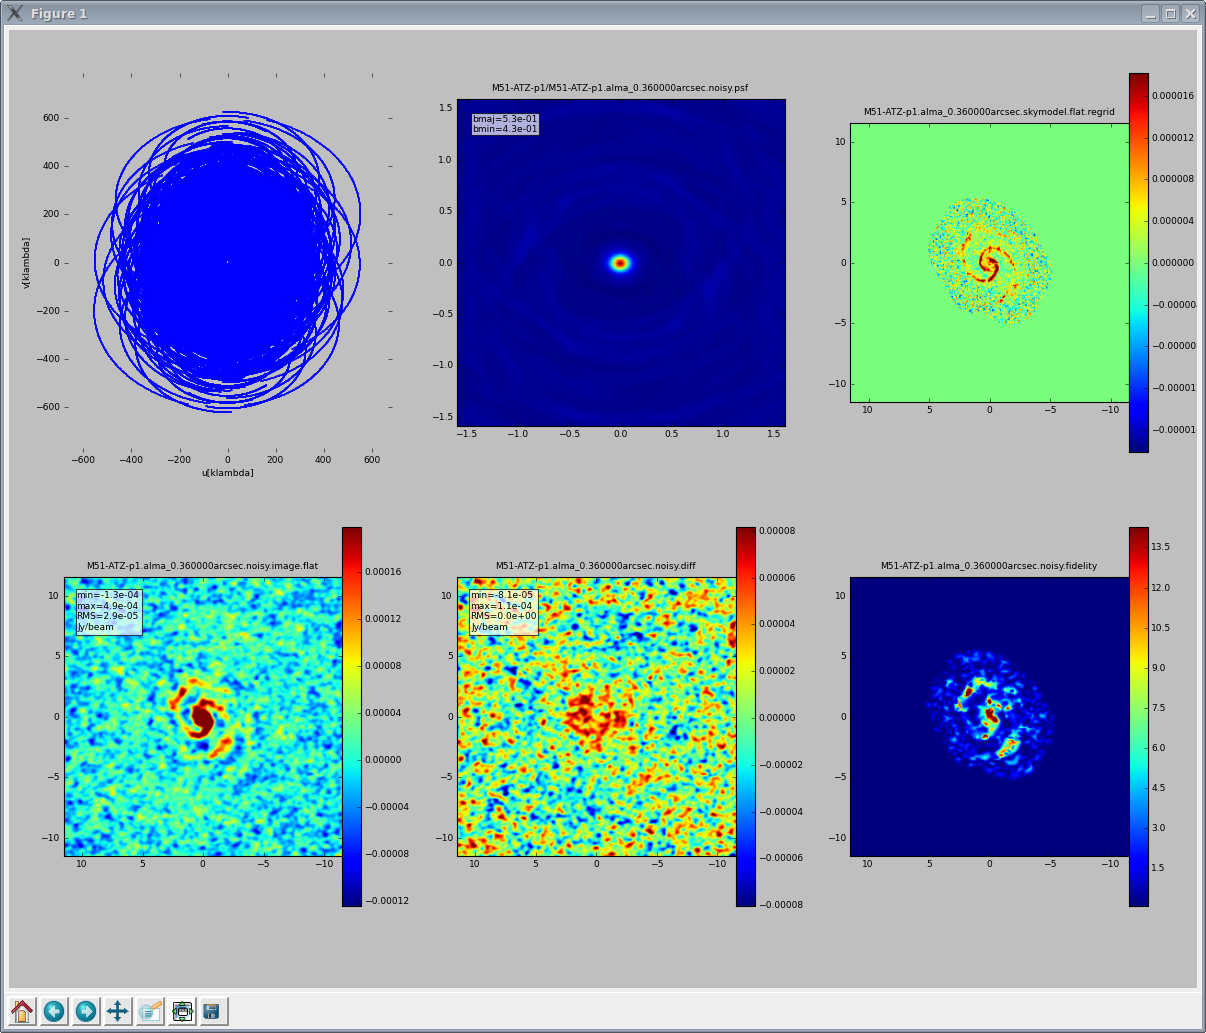 |
549 KB | 2x3 summary plot displayed by sim_analyze | 1 |
| 20:42, 16 December 2011 | Antcont Northall.ms.pointings.png (file) | 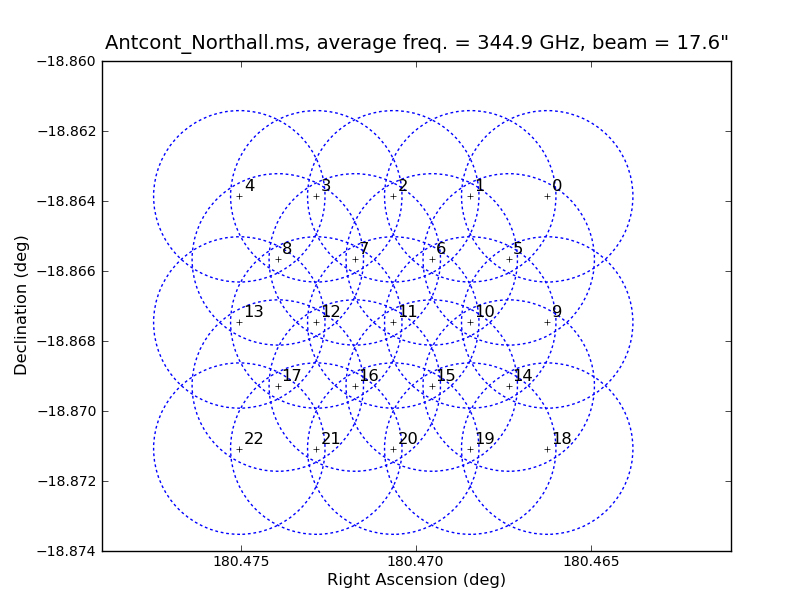 |
109 KB | Analysis Utilities plotmosaic output, with absolute coordinates. | 1 |
| 20:45, 16 December 2011 | Antcont Northall.ms.pointings.relative.png (file) | 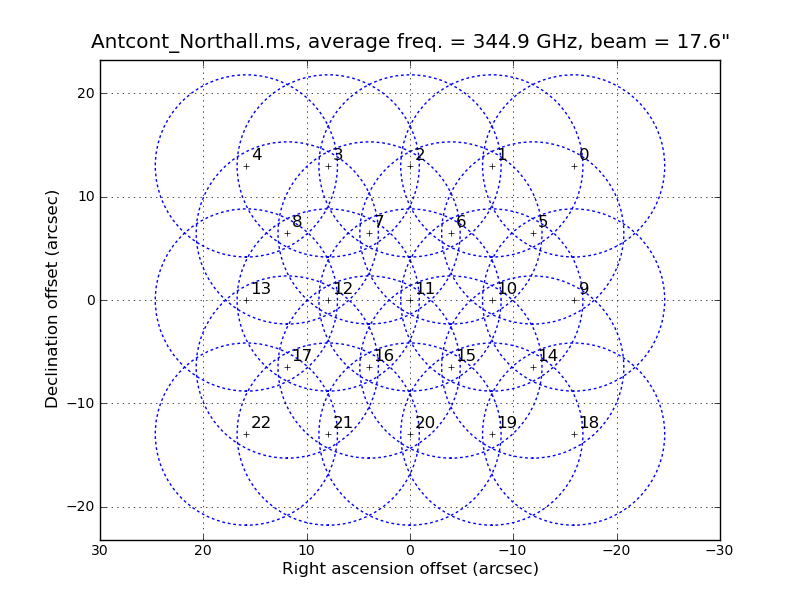 |
116 KB | Analysis Utilities plotmosaic output, with relative coordinates. | 1 |
| 20:53, 16 December 2011 | Band7multi april22.ms.weather.png (file) | 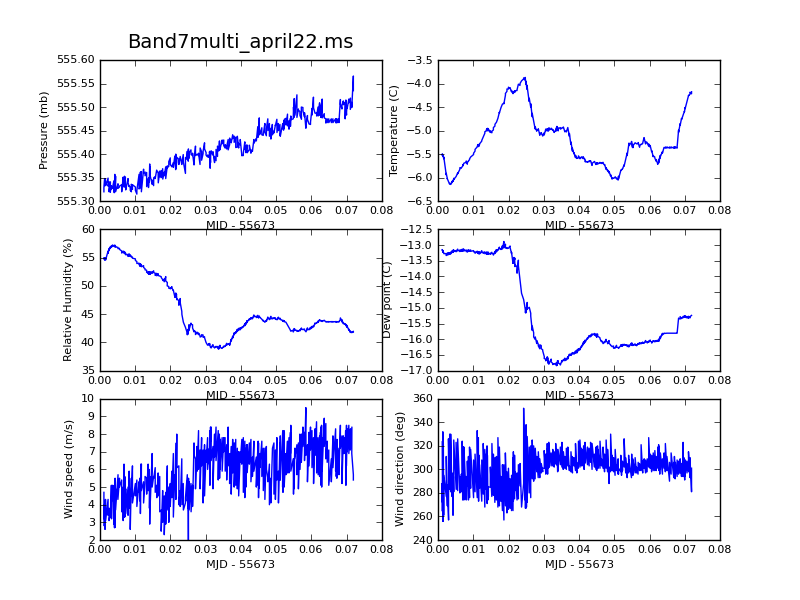 |
84 KB | Analysis Utilities plotWeather output. | 1 |
| 15:26, 4 January 2012 | Bandpass.DV07.spw0.t1.png (file) | 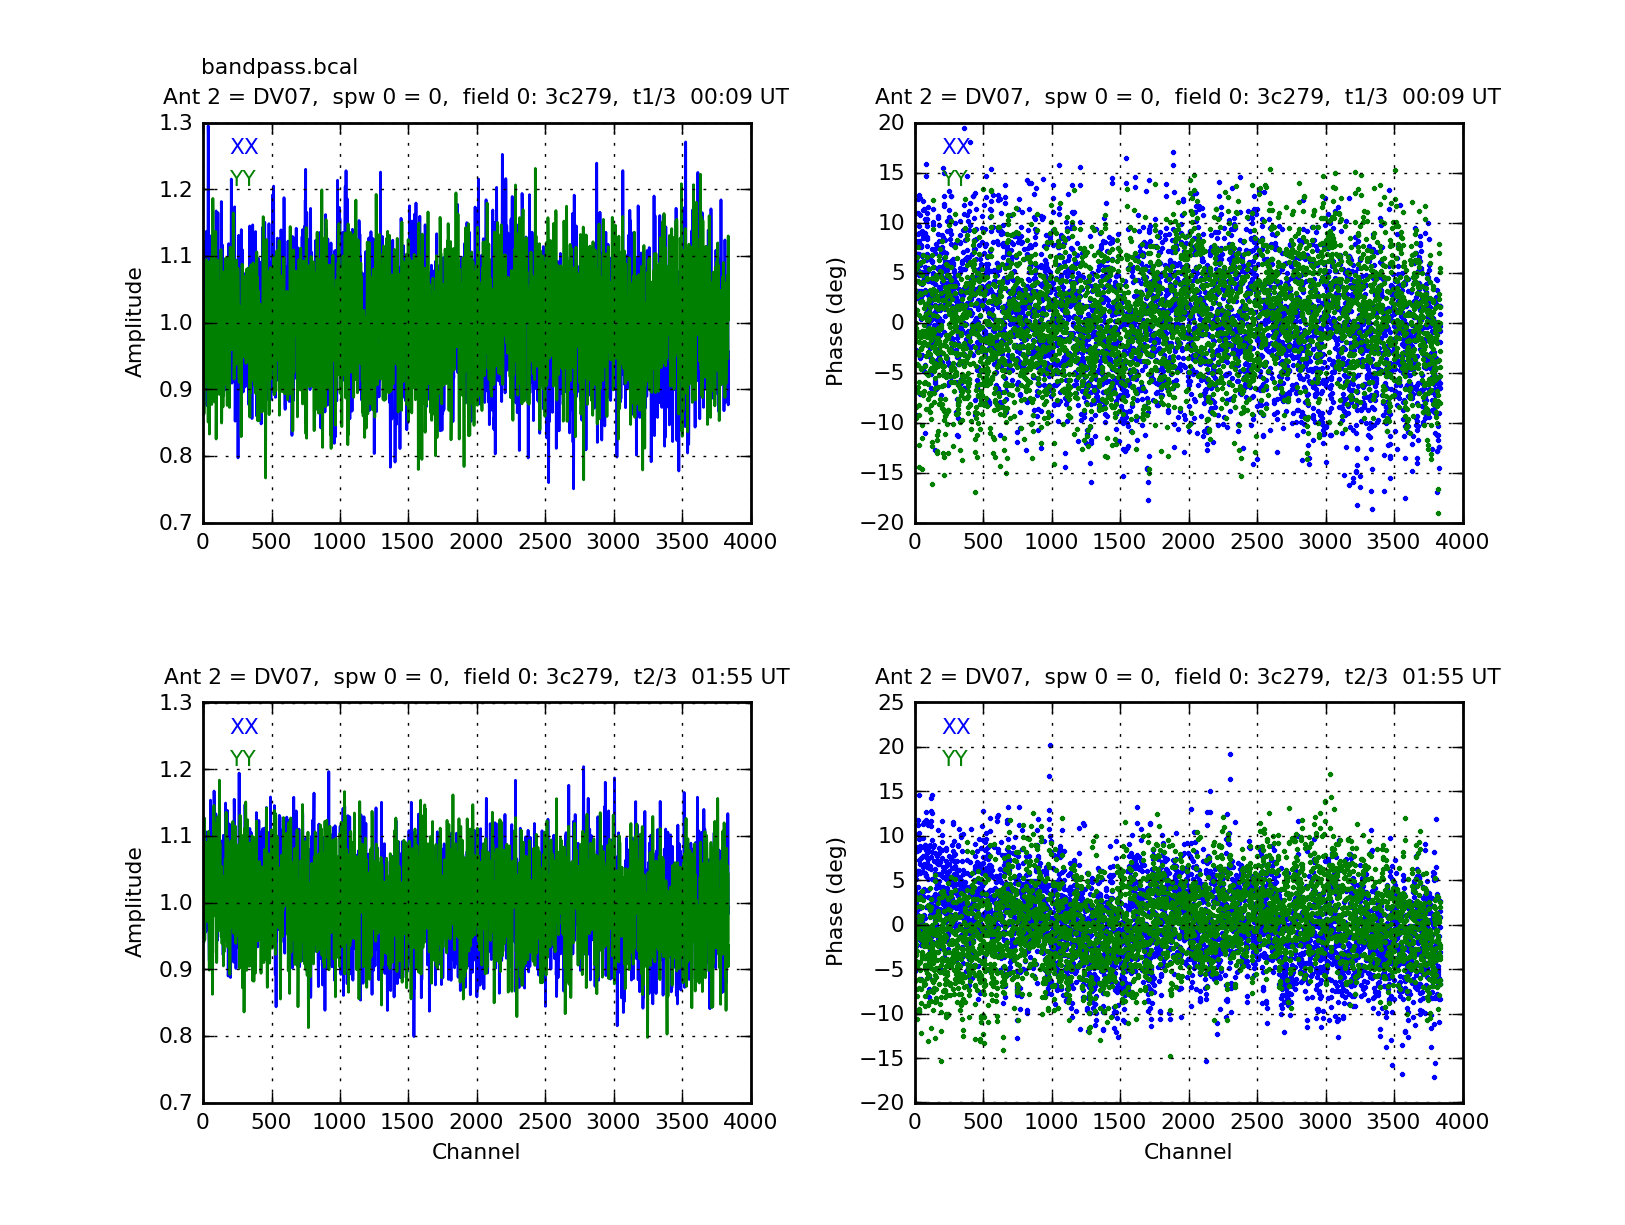 |
381 KB | Use analysisUtils.plotBandpass to display a simple bandpass solution. | 1 |
| 15:32, 4 January 2012 | Bandpass phase.DV07.spw0.t1.png (file) | 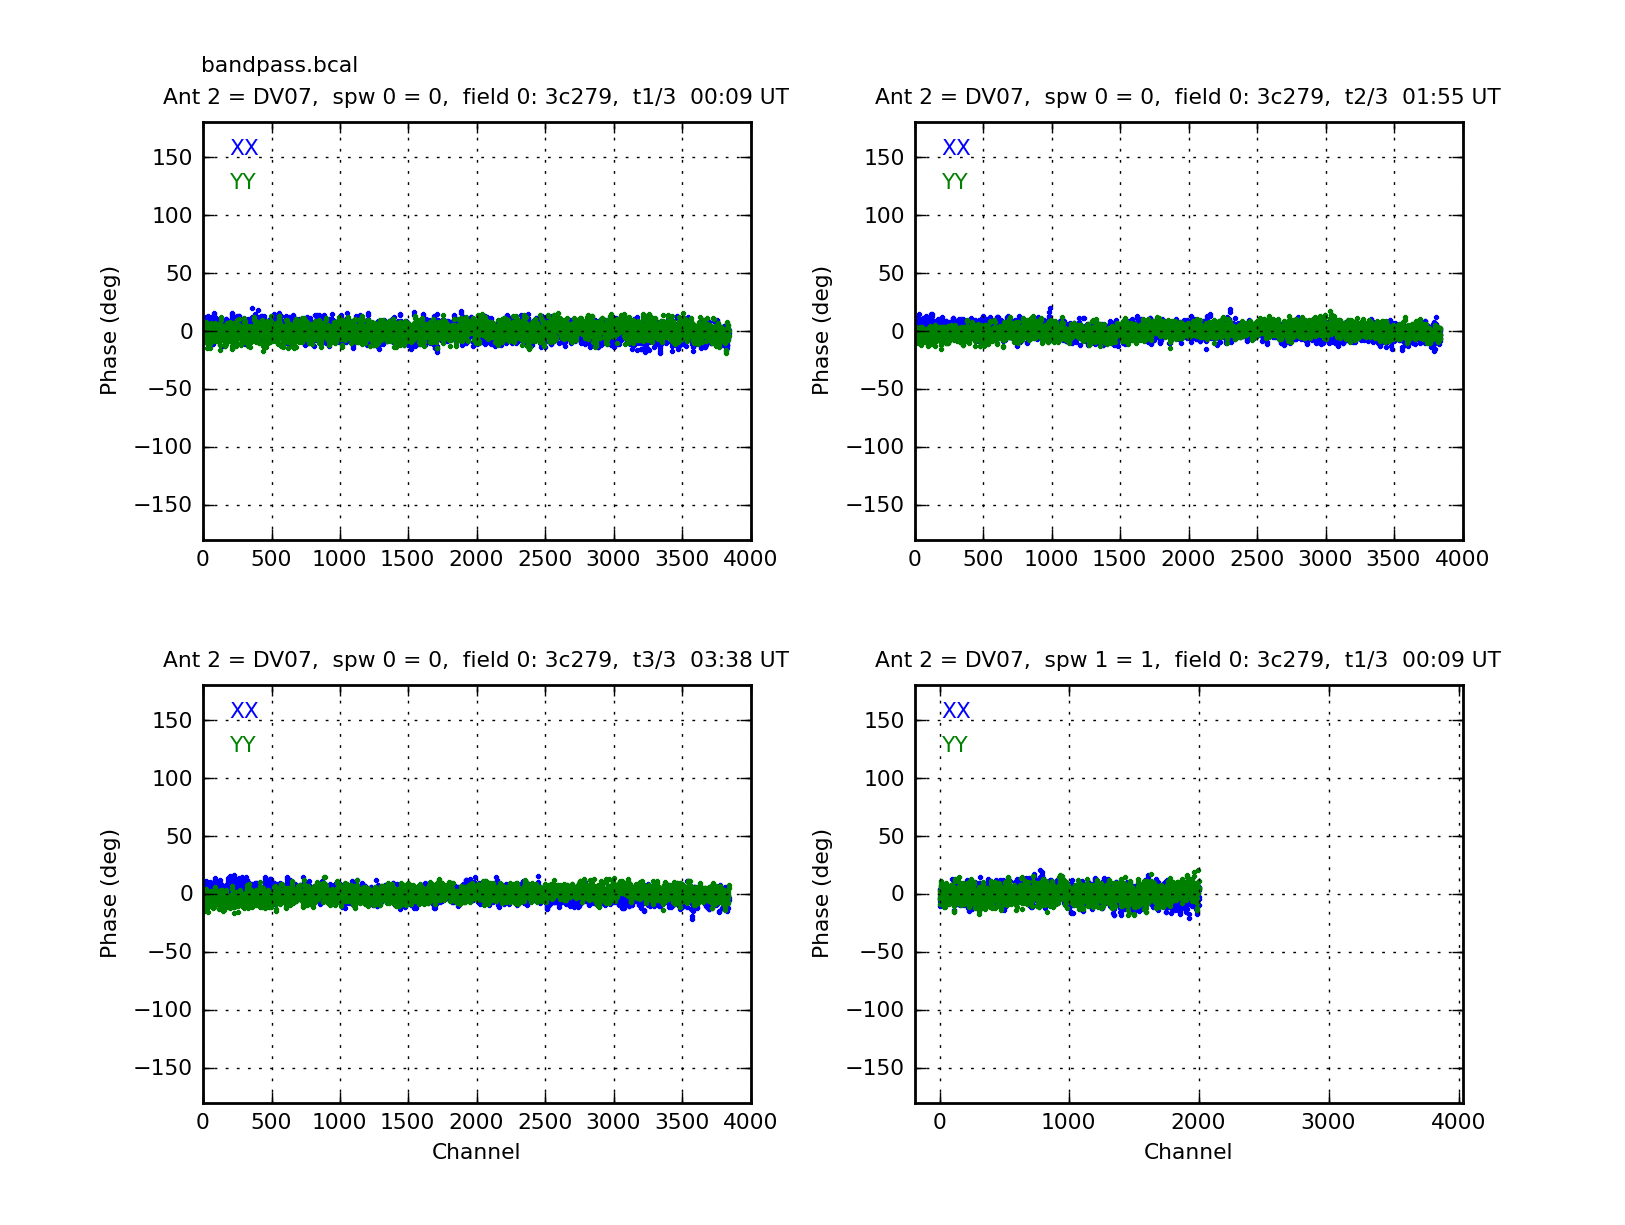 |
127 KB | Use analysisUtils.plotBandpass to display a simple bandpass solution with specified y-axis scaling. | 1 |
| 15:45, 4 January 2012 | Bpoly overlay.DV09.spw0.t1.png (file) |  |
219 KB | Use analysisUtils.plotBandpass to display a bandpass solution with a BPOLY solution overlaid. | 1 |
| 15:51, 4 January 2012 | Smooth.DV07.spw0.t1.png (file) | 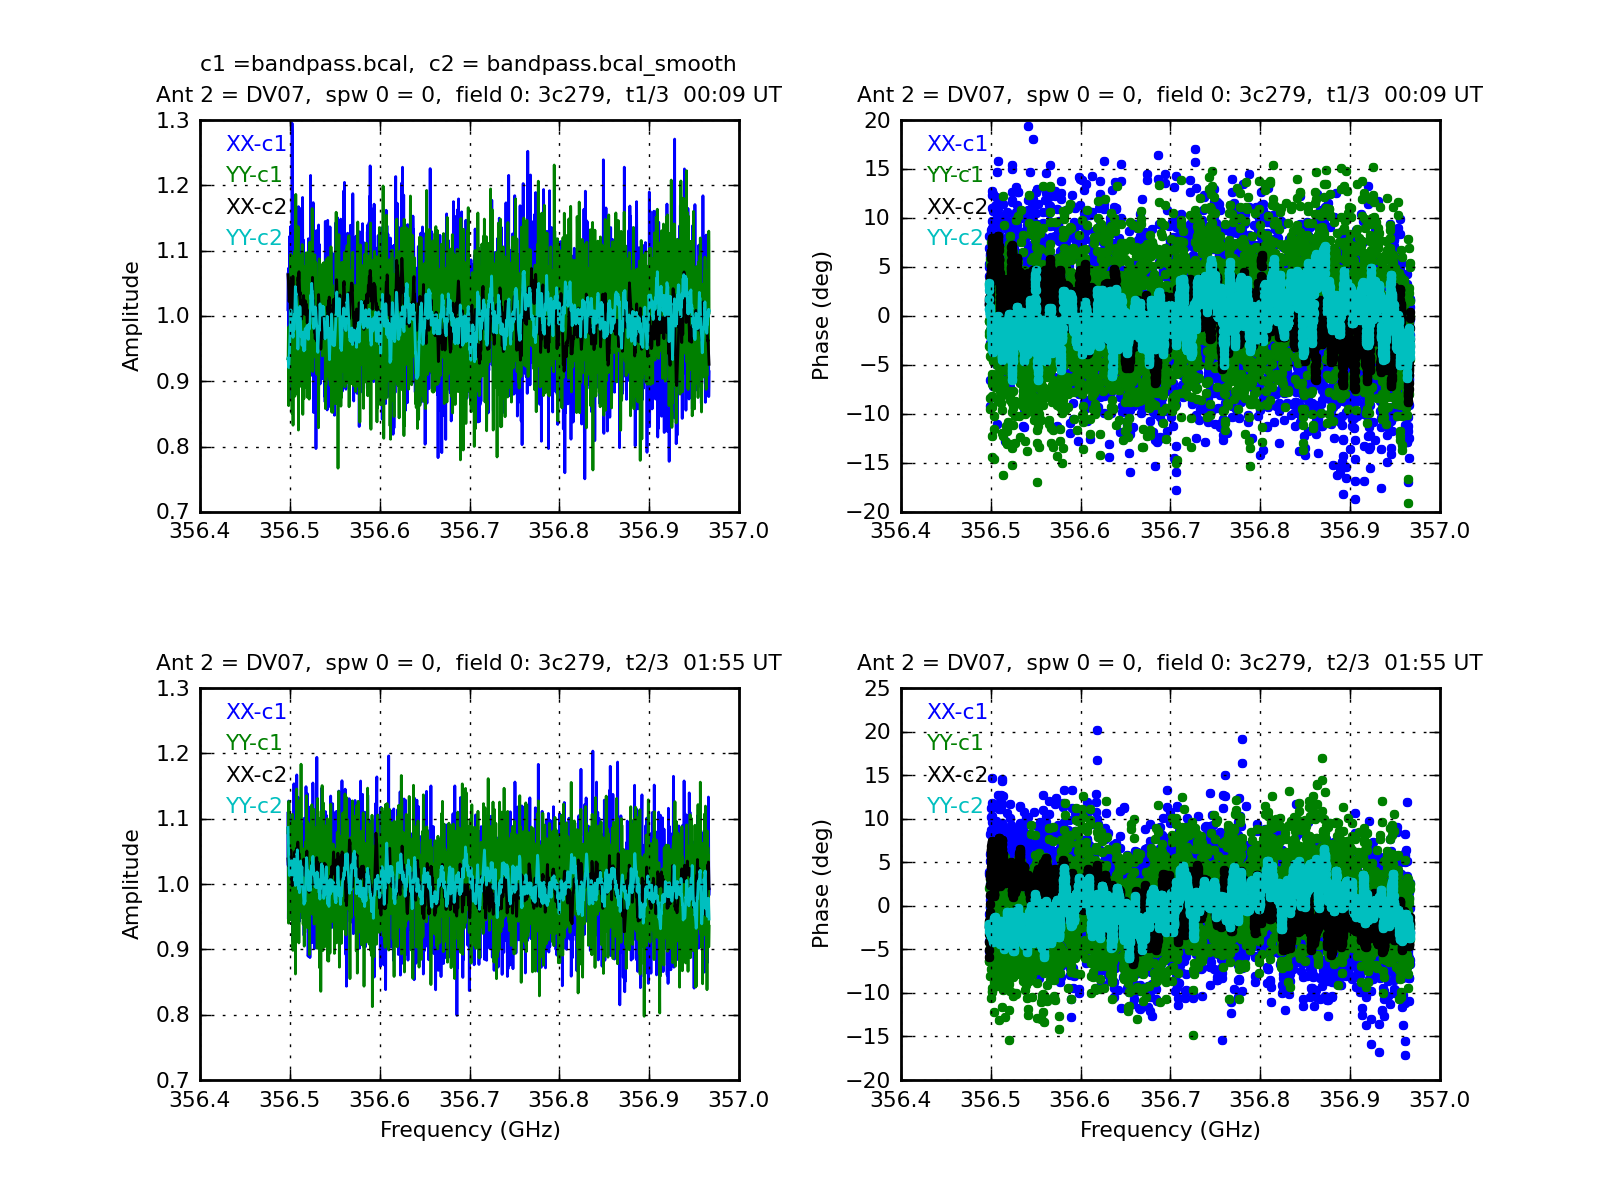 |
346 KB | Use analysisUtils.plotbandpass to plot a bandpass solution with a smoothed solution from analysisUtils.smoothbandpass overlaid. | 1 |
| 16:03, 4 January 2012 | Tsys chan.DV04.spw0.t1.png (file) | 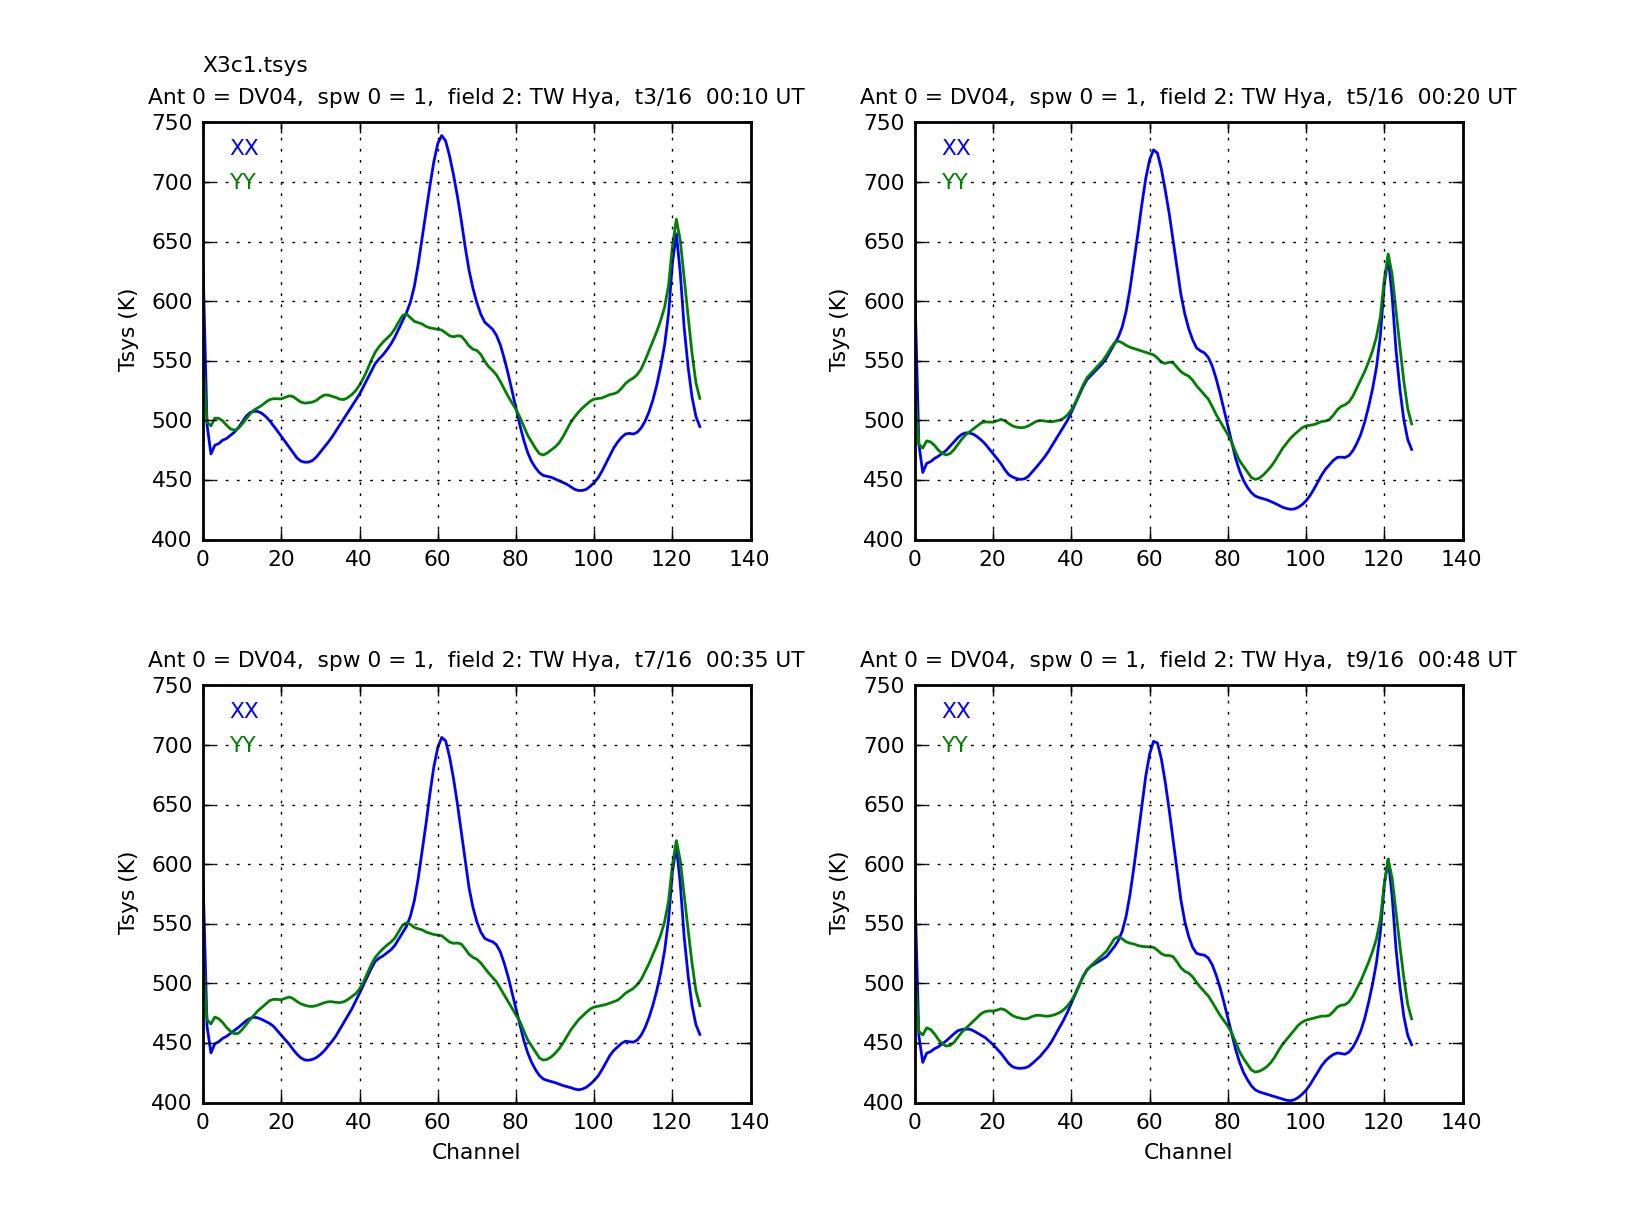 |
205 KB | Use analysisUtils.plotbandpass to display a Tsys solution for one field. | 1 |
| 16:06, 4 January 2012 | Tsys antenna overlay.spw0.t1.png (file) | 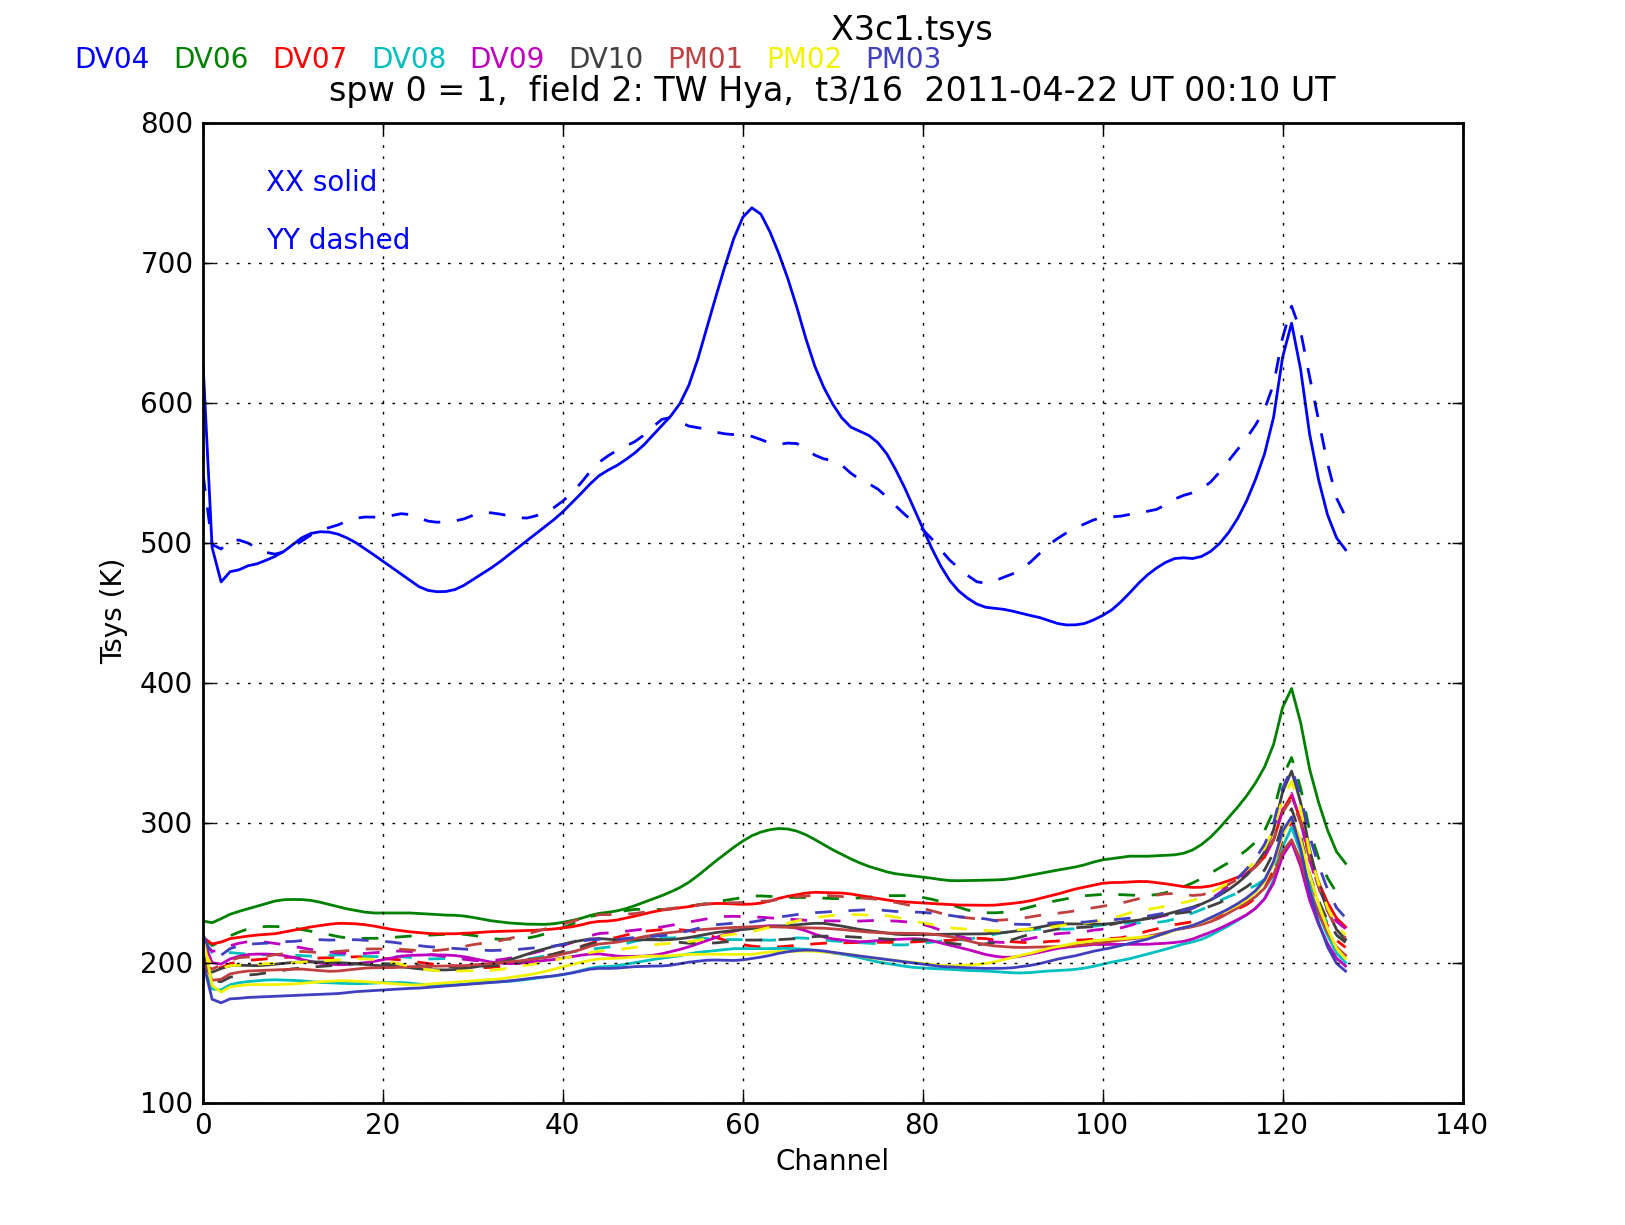 |
224 KB | Use analysisUtils.plotbandpass to plot Tsys solutions for all antennas. | 1 |
| 16:12, 4 January 2012 | Tsys overlay.DV04.spw0.png (file) |  |
349 KB | Use analysisUtils.plotbandpass to overlay Tsys solutions for all antennas. | 1 |
| 16:19, 4 January 2012 | Tsys.DV04.spw0.t1.png (file) |  |
249 KB | Use analysisUtils.plotbandpass to display Tsys solutions for TDM and interpolated results for FDM. | 1 |
| 16:22, 4 January 2012 | Tsyszoom.DV04.spw0.t1.png (file) | 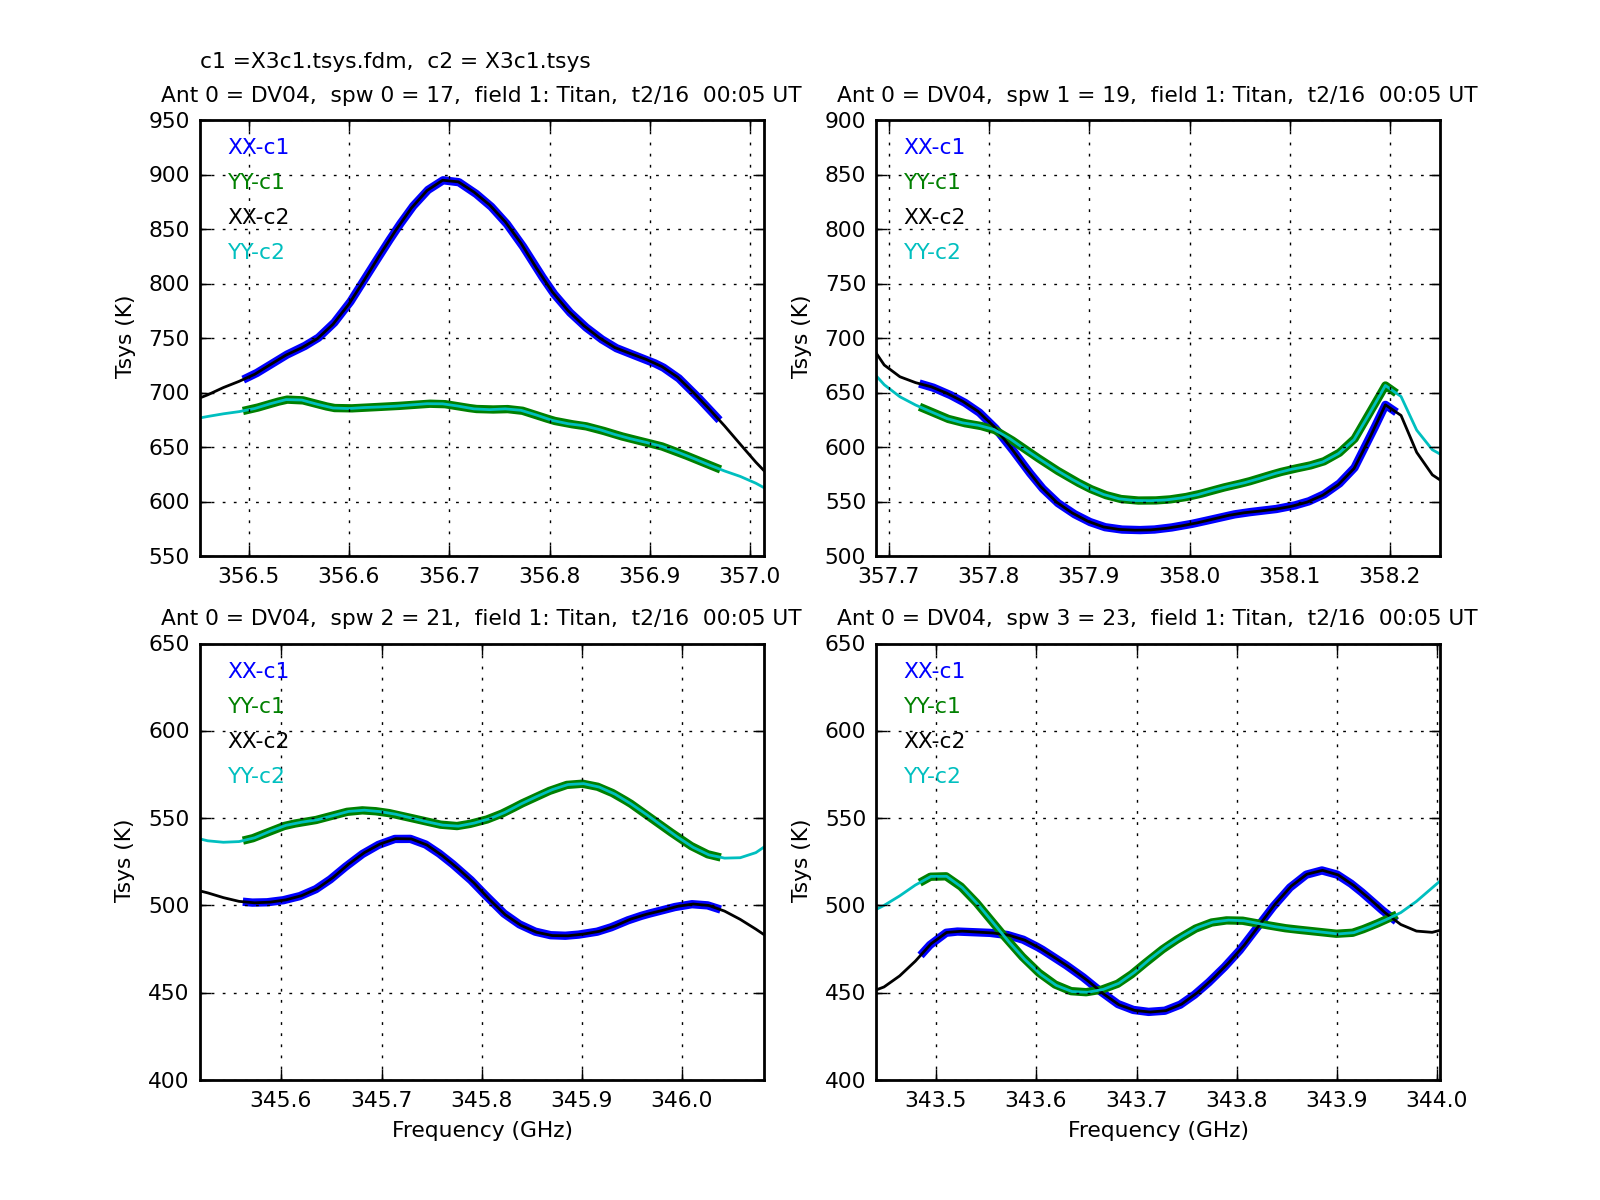 |
218 KB | Use analysisUtils.plotbandpass to plot a zoomed-in version of Tsys for TDM and interpolated solutions for FDM. | 1 |
| 16:29, 4 January 2012 | Showatm.DV02.spw1.t3.png (file) | 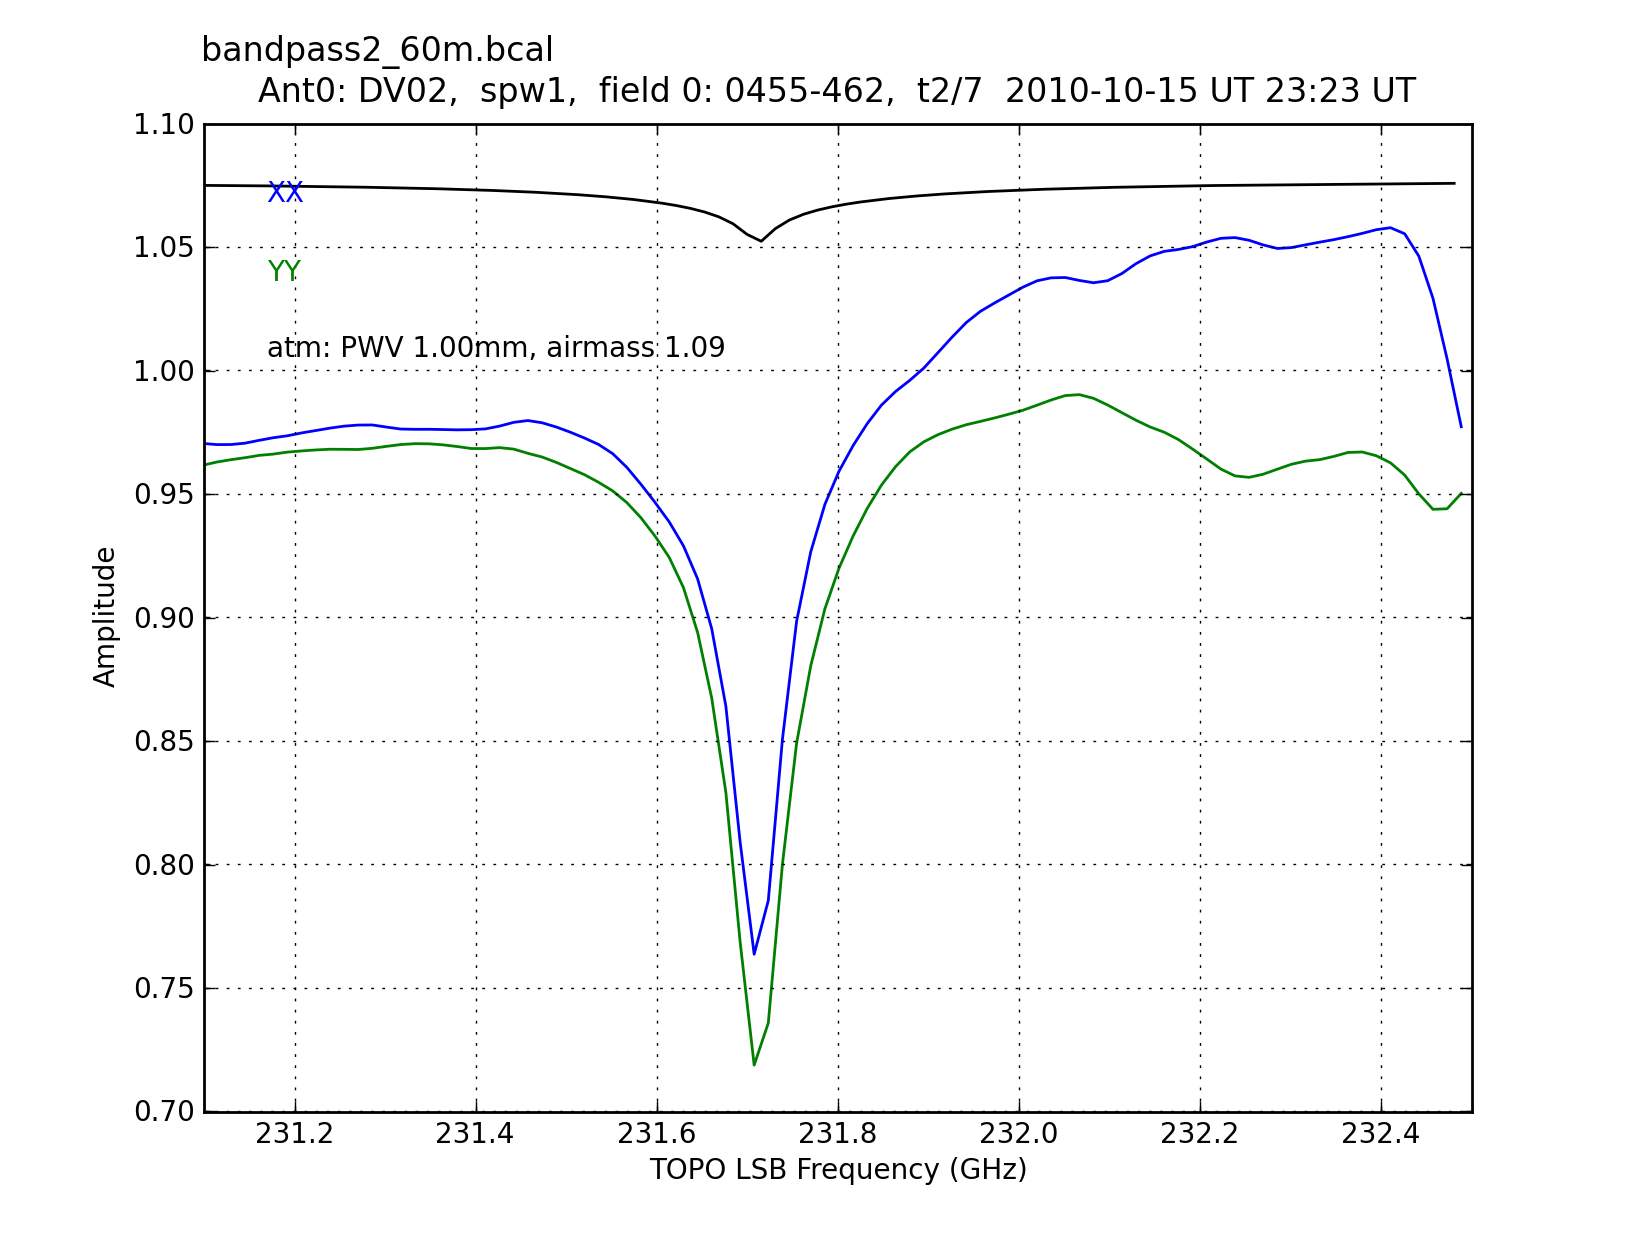 |
145 KB | Use analysisUtils.plotbandpass to overlay the atmospheric transmission curve. | 1 |
| 16:38, 4 January 2012 | Fullrange.DV02.spw0.t1.png (file) | 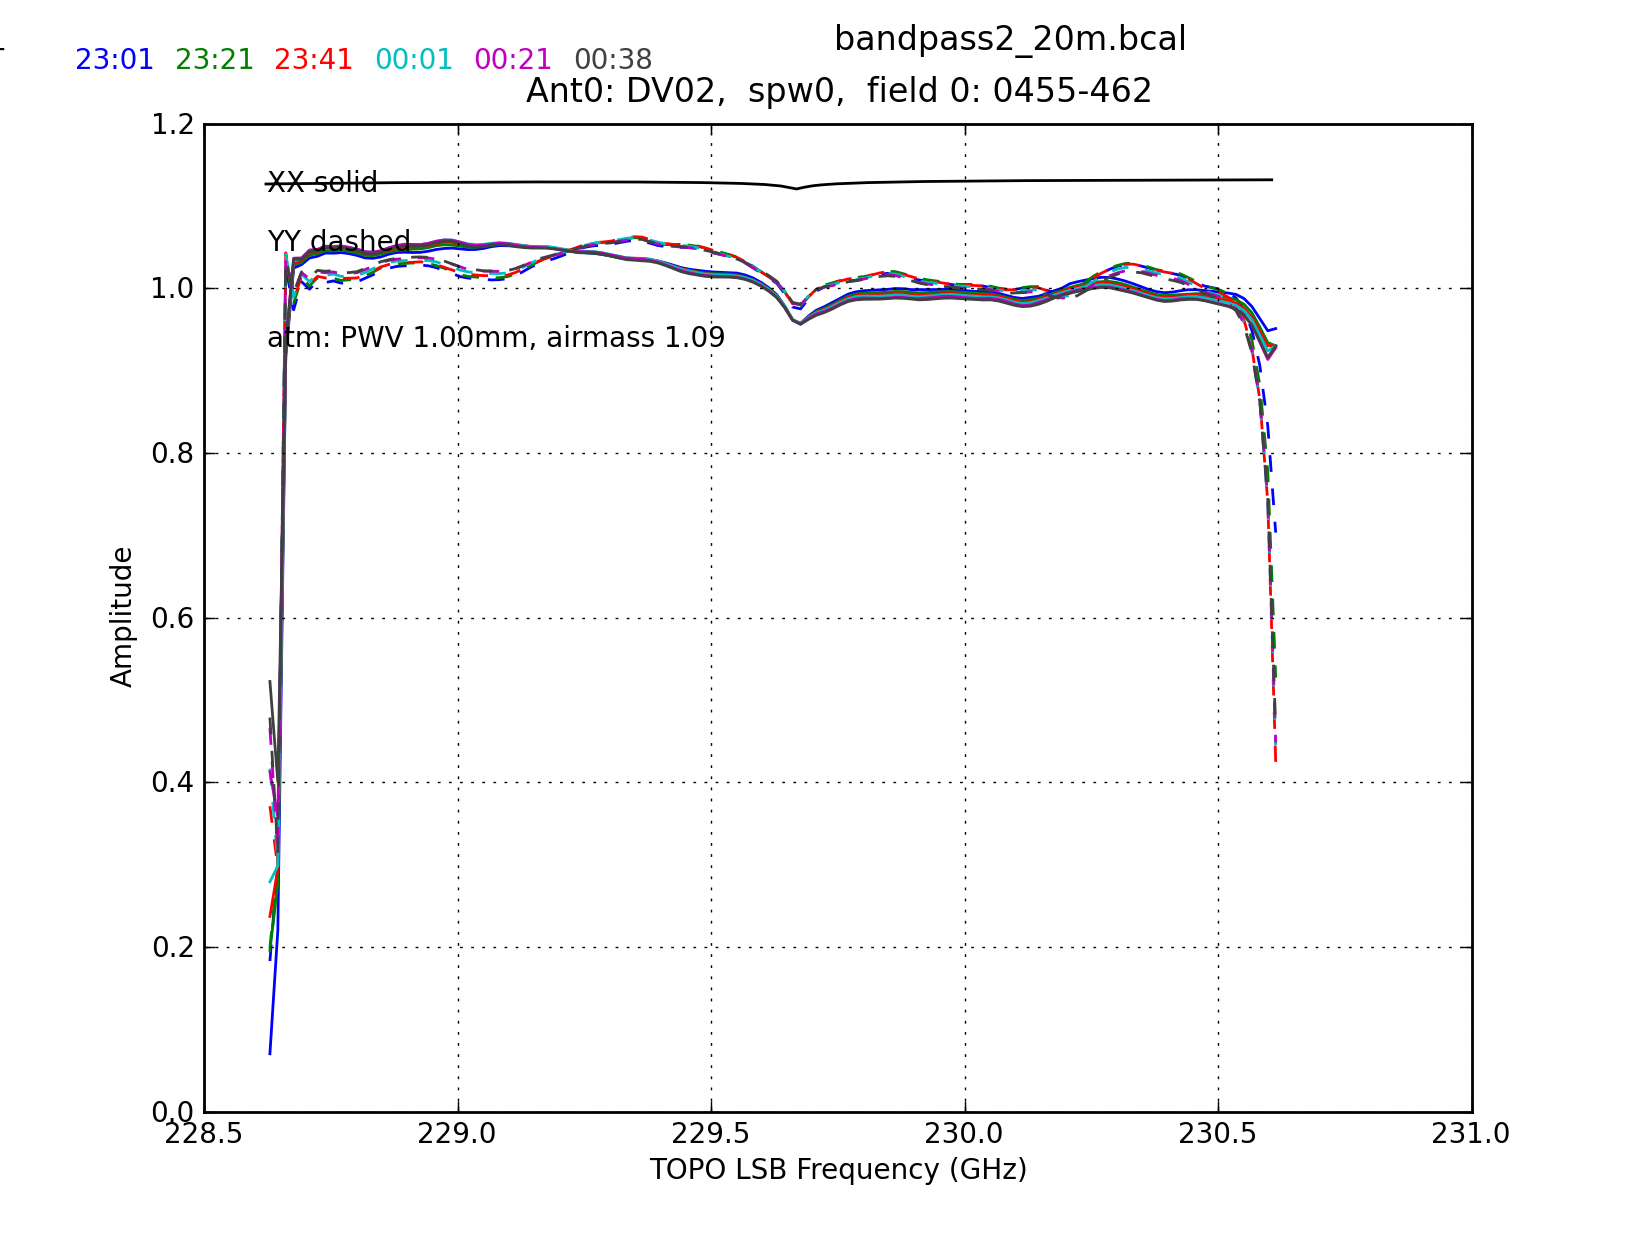 |
156 KB | analysisUtils.plotbandpass display of bandpass with full channel range. | 1 |
| 16:43, 4 January 2012 | Limitedrange.DV02.spw0.t1.png (file) | 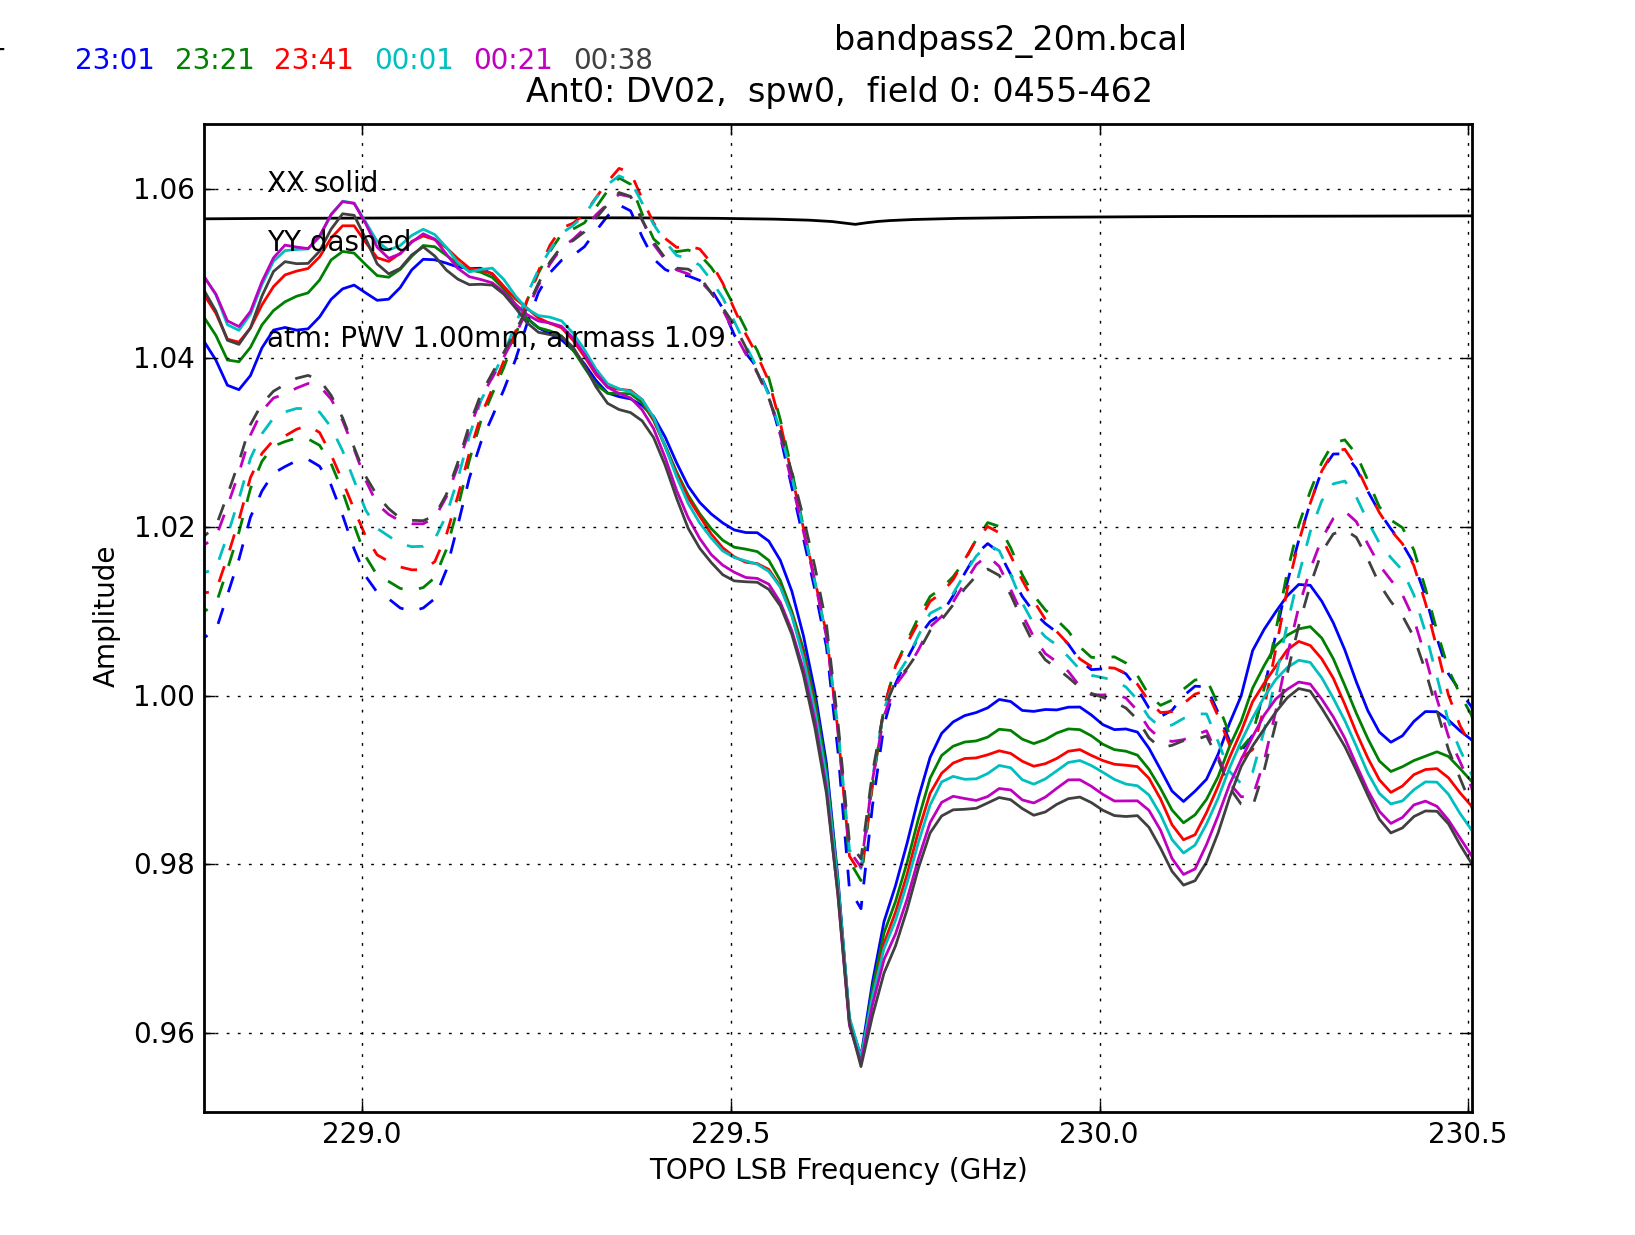 |
330 KB | Use analysisUtils.plotbandpass to plot bandpass with edge channels removed. | 1 |
| 17:18, 9 January 2012 | IRC10216 clean.png (file) |  |
213 KB | Image of CASA viewer during cleaning process for IRC+10216. | 1 |
| 17:21, 9 January 2012 | IRC10216 cleaned.png (file) | 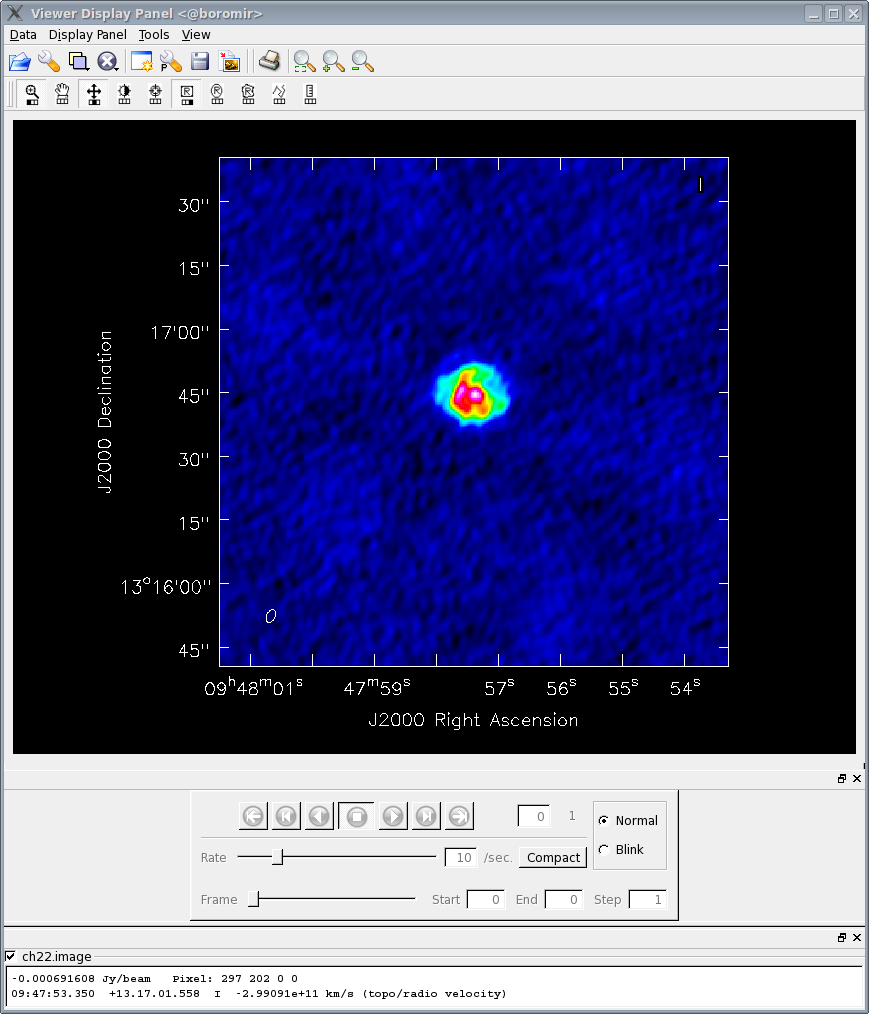 |
133 KB | Cleaned image of IRC+20216 SiS line. | 1 |
| 17:30, 9 January 2012 | IRC10216 SiS mom0.png (file) |  |
102 KB | IRC+10216 SiS moment-0 map displayed in the CASA Viewer. | 1 |
| 15:48, 24 April 2012 | X3c1.tsys.field0.DV04.spw1.t1.png (file) | 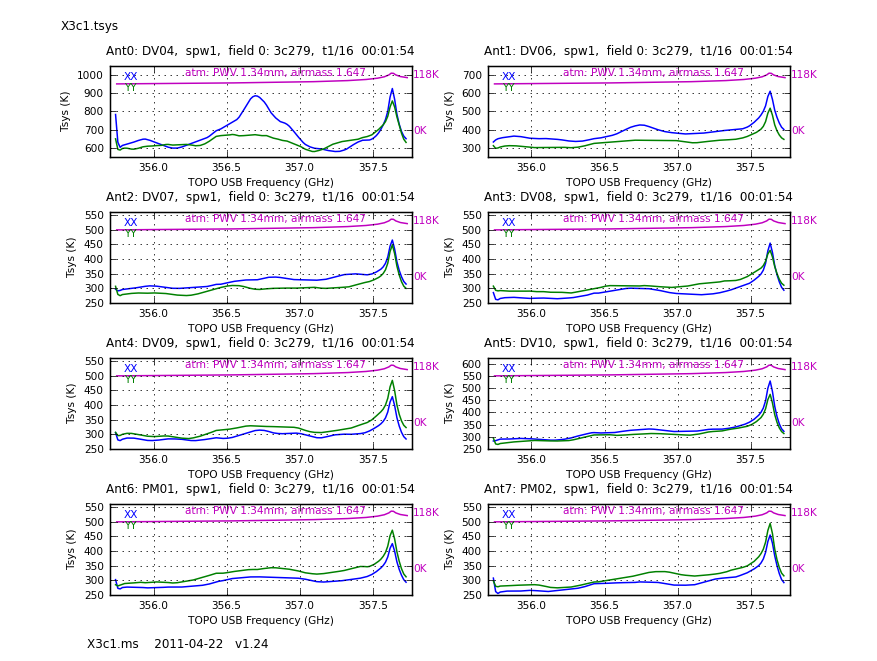 |
138 KB | Corrected figure. | 2 |
| 16:00, 24 April 2012 | X3c1.tsys.field0.DV04.spw3.t1.png (file) | 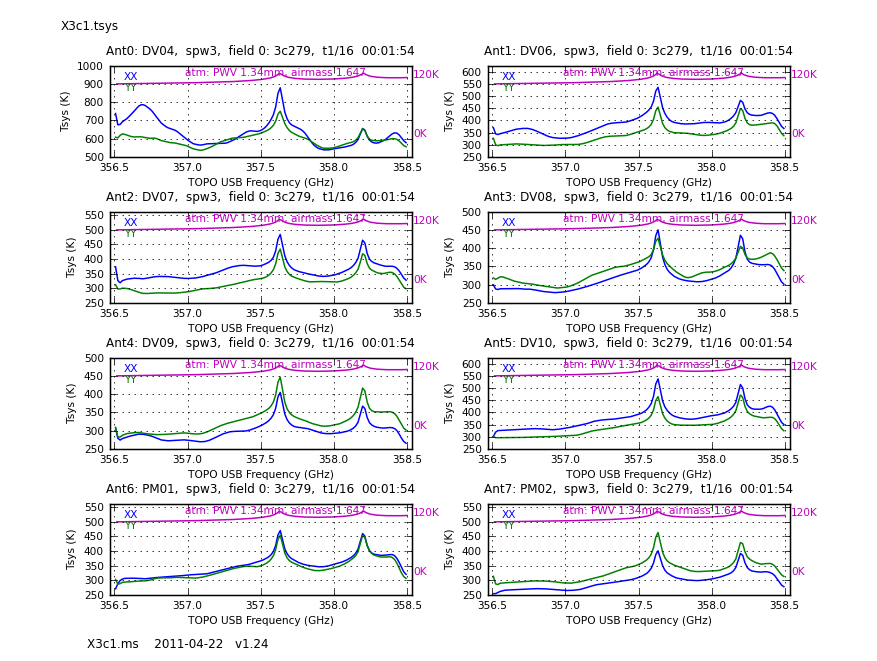 |
157 KB | corrected figure. | 2 |
| 21:19, 24 April 2012 | Titan amp vs uvdist.png (file) | 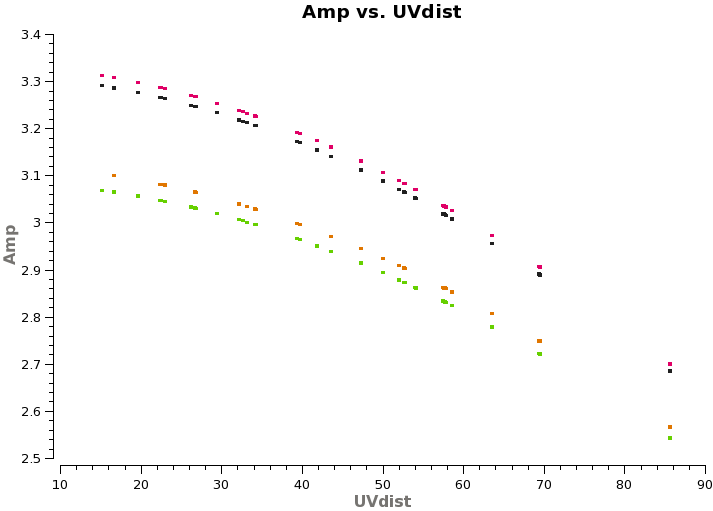 |
14 KB | Titan model plotted as Amp vs. uvDist. | 1 |
| 19:15, 25 April 2012 | ThreeScansAmp.png (file) |  |
146 KB | updated figure | 2 |
| 19:27, 25 April 2012 | ThreeScansPhase.png (file) |  |
158 KB | updated figure. | 2 |
| 20:01, 25 April 2012 | Bandpass.ampspw0.png (file) | 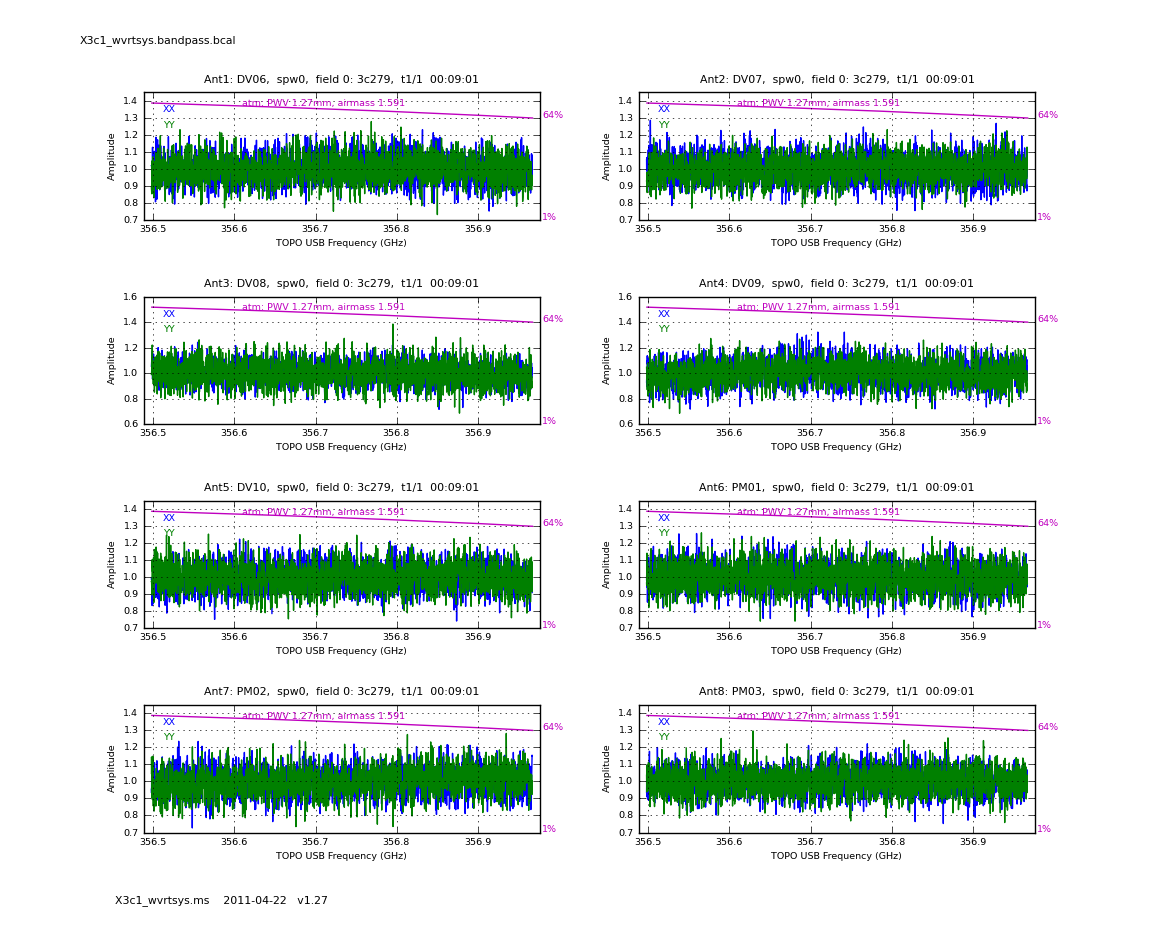 |
234 KB | switched to analysisUtils.plotbandpass | 2 |
| 20:33, 25 April 2012 | Bandpass.phasespw0.png (file) | 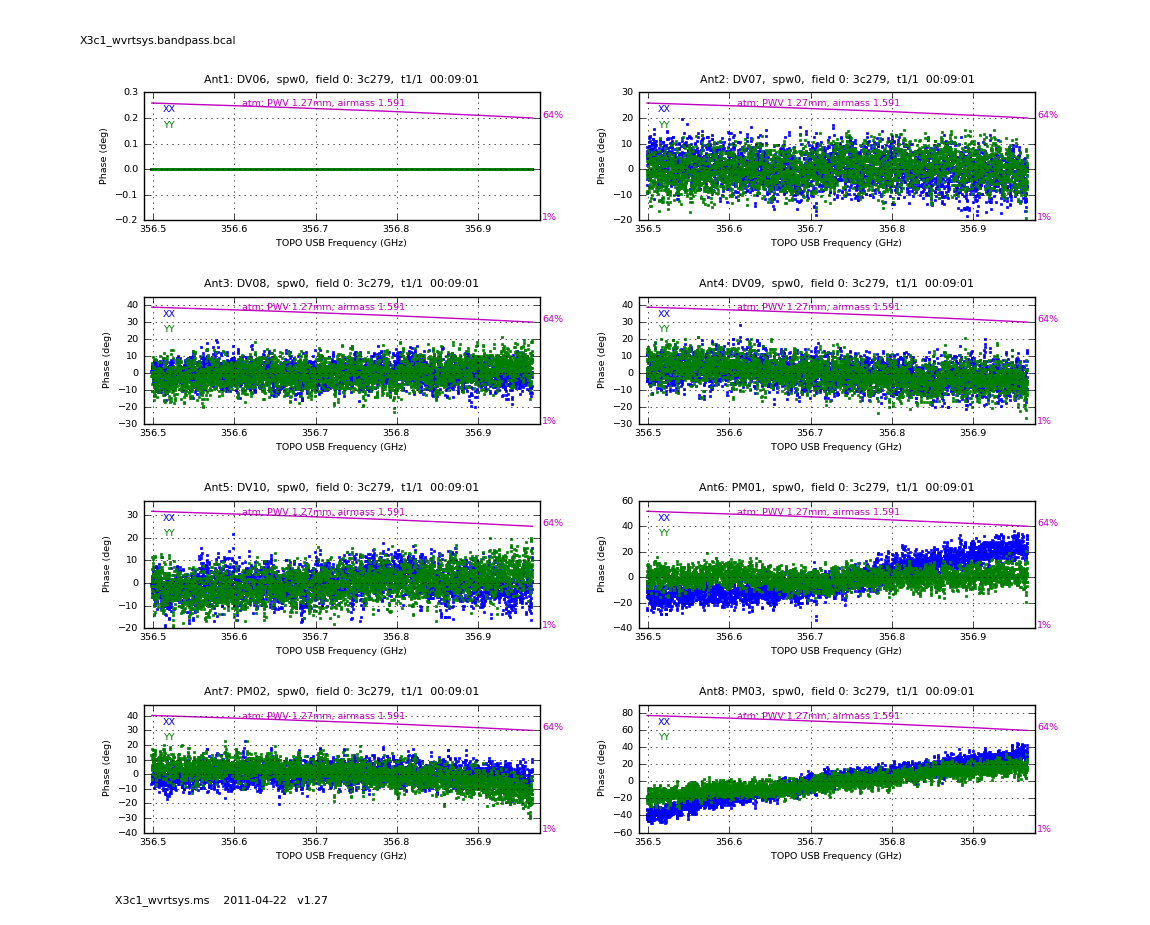 |
293 KB | using analysisUtils.plotbandpass | 2 |
| 14:47, 27 April 2012 | Selfcal time.png (file) | 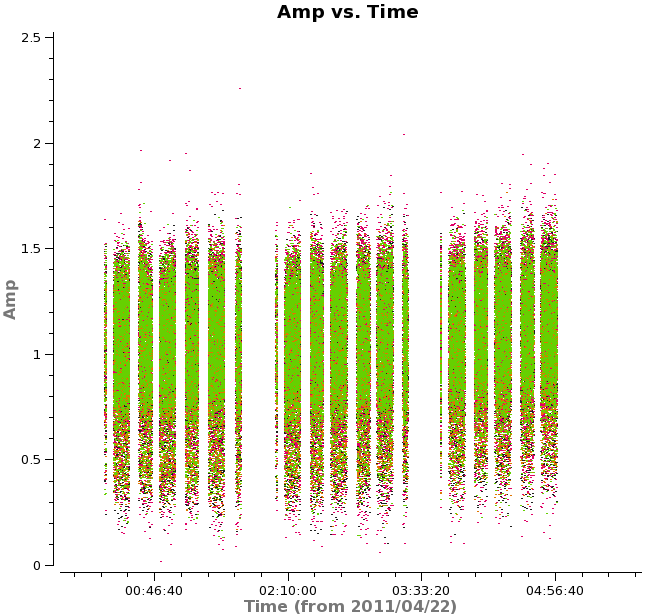 |
50 KB | removed labeling error on x-axis | 2 |
| 16:53, 8 May 2012 | North selfchan model.png (file) | 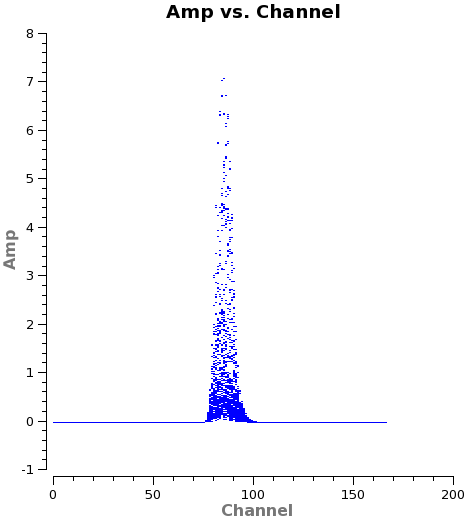 |
11 KB | Plot of the CO(3-2) emission from the model column of field 12 of the northern mosaic. | 1 |
| 19:59, 8 May 2012 | South selfchan model.png (file) | 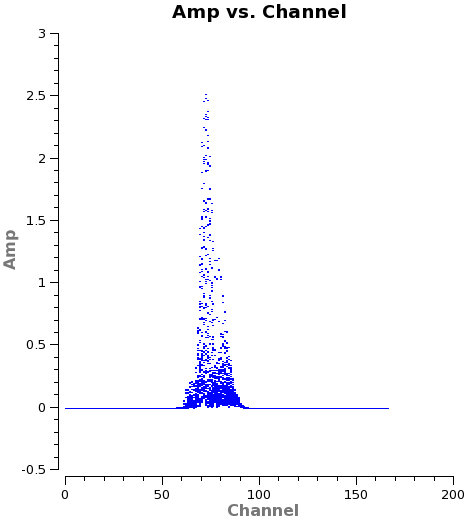 |
11 KB | Plot of the CO(3-2) emission from the model column for Field 7 of the Southern mosaic. | 1 |
| 14:50, 10 May 2012 | TWHya CO3 2 moments.png (file) |  |
273 KB | Same image resized so I can use the frame option and display the image caption. (When using frame, media wiki ignores size. So I'm setting the size manually.) | 3 |
| 14:53, 10 May 2012 | TWHya HCOp4 3 moments.png (file) |  |
253 KB | Same image resized so I can use the media wiki image 'frame' option. When using frame, size is ignored. So, I'm setting size manually. | 2 |
| 15:02, 10 May 2012 | TWHya channel co3 2.png (file) | 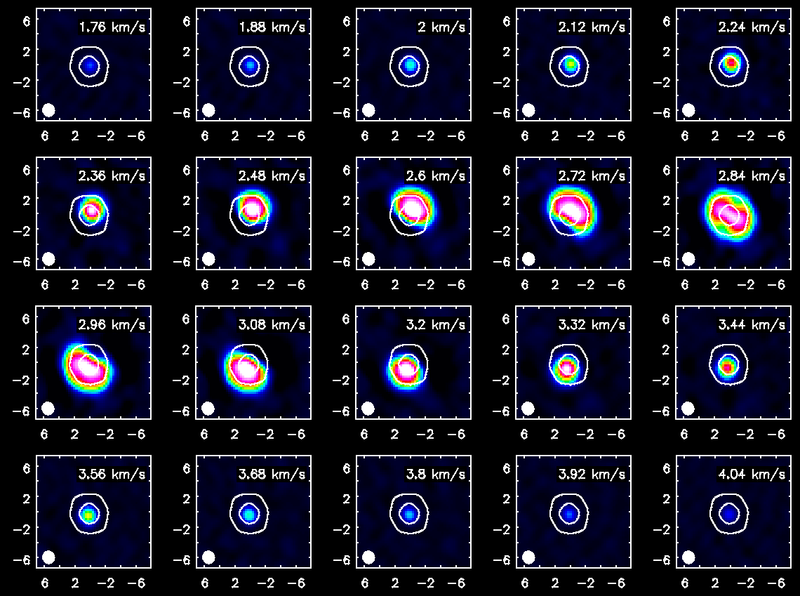 |
805 KB | Resized so it works with frames. | 2 |
| 20:29, 30 May 2012 | Simobserve.inputs.png (file) | 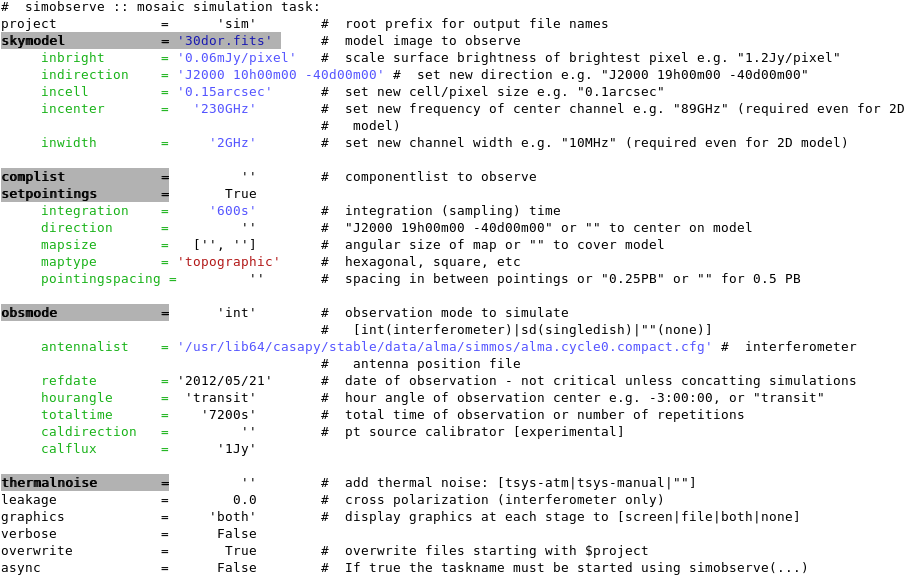 |
101 KB | simobserve inputs (CASA 3.4) | 1 |
| 16:38, 6 June 2012 | Sim.alma cycle1 1.observe.png (file) | 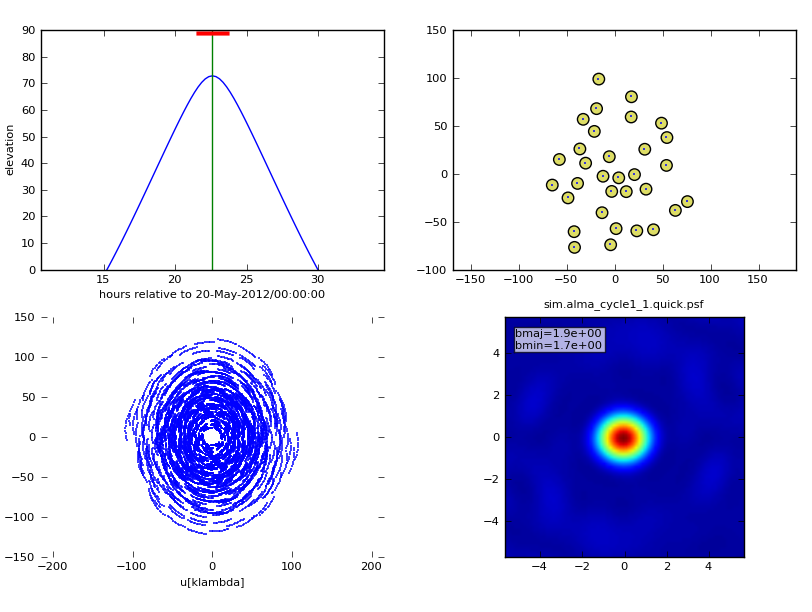 |
90 KB | simobserve composite image. Cycle 1. | 1 |
| 21:00, 5 November 2012 | 2010 titan model.png (file) | 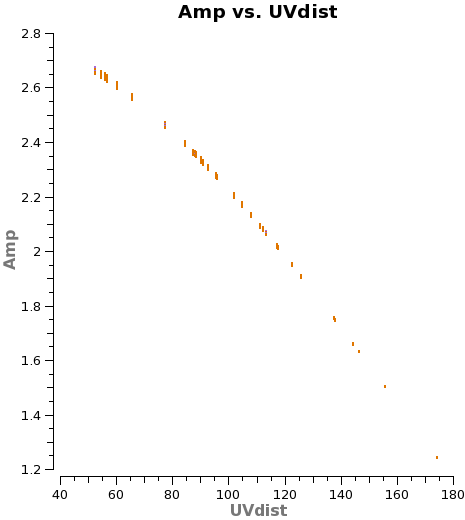 |
11 KB | Model of Titan from Butler-JPL-Horizons 2010. | 1 |
| 21:02, 5 November 2012 | 2012 titan model.png (file) | 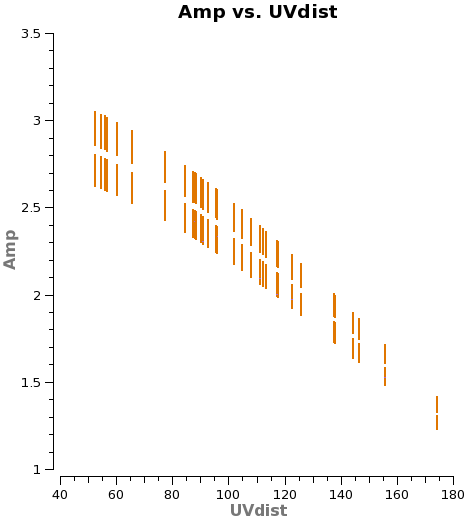 |
10 KB | Titan model produced by Butler-JPL-Horizons 2012. | 1 |
| 15:56, 6 November 2012 | Twhydra X3c1 wvrtsys 2012 titan model.png (file) | 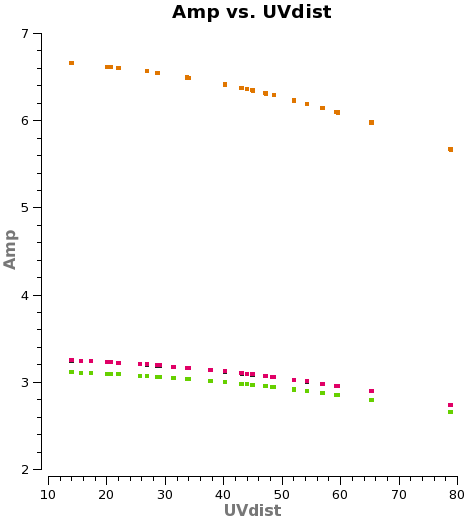 |
10 KB | Titan model for X3c1_wvrtsys.ms in THydra calibration guide using Butler-JPL-Horizons 2012 standard. | 1 |